Alarm Log
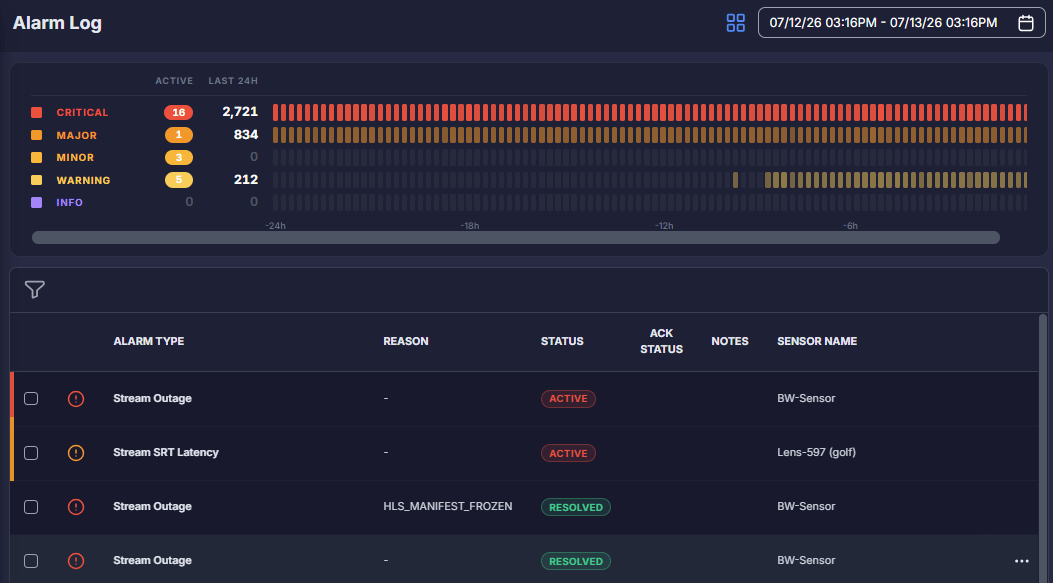
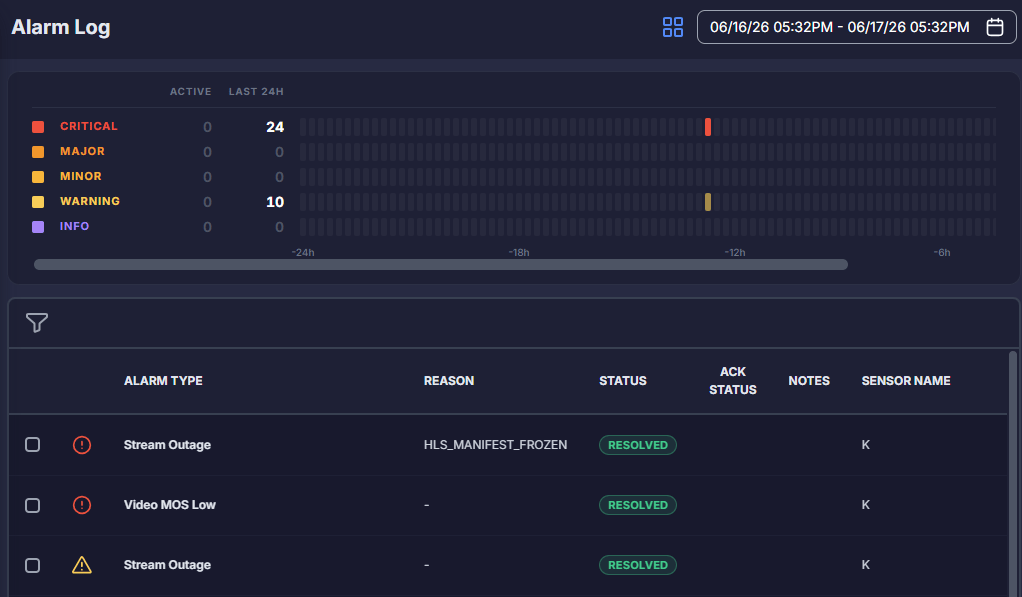
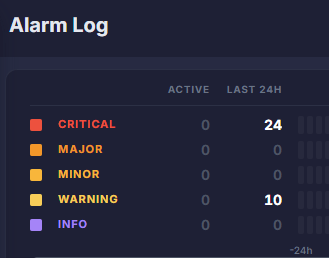
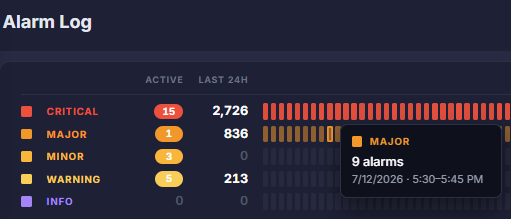
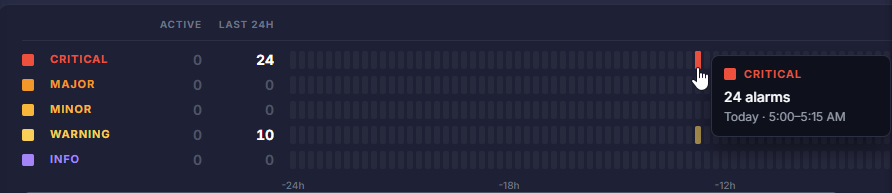
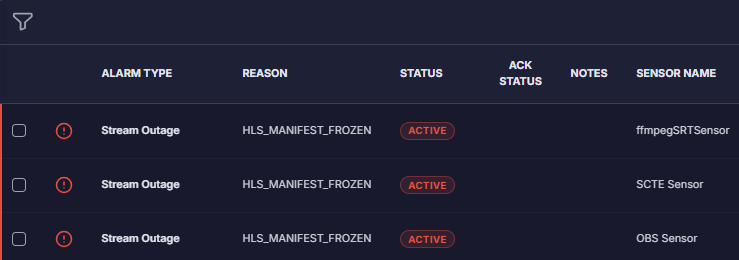
The Alarm Log displays a list of all active and recent system alerts across your monitored sources. It serves as the heartbeat of your monitoring operation, providing an essential audit trail of every glitch or error (such as a frozen video, missing caption, or SCTE-35 ad signaling failure). The Alarm Log provides instant context for why a channel is failing and enables you to filter incidents, generate reports, manually acknowledge or close alerts, and perform one-click root-cause investigations. For details about configuring alarms, see Monitoring Templates.View the Alarm Log
To view the Alarm Log, do one of the following:- Click Alarm Log on the Lens menu.
- Add an Alarm Log widget to a multiviewer and then click the widget. See Configure an Alarm Log Widget.
- Click Sensors on the Lens menu and then click an active sensor. In the Preview box that appears, click Alarms. See Preview a Sensor.
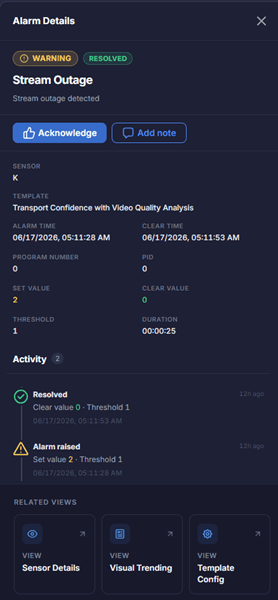
Alarm Life Cycle
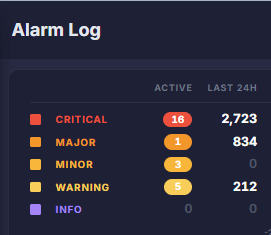
An alarm progresses through the following states:- Active: An alert has been generated by the system and is currently unresolved.
- Acknowledged: A user has reviewed the alert and manually acknowledged it.
- Cleared: The underlying error condition has stopped persisting, and the system automatically resolves the alert.
- Closed/Resolved: If a user manually closes an alert or deactivates a sensor affiliated with an alarm, the alarm transitions into a Resolved state. The username and the reason for closing the alarm are logged in an alarm note.
Filter the Alarm Log
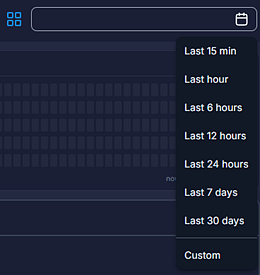
By default, the Alarm Log page displays alarm information for the past 24 hours. To display only alarms that occurred during a particular date and time, click the calendar icon on the top right and select one of the following:- Last 15 min: To view alarms that occurred within the last 15 minutes.
- Last hour: To view alarms that occurred within the last hour.
- Last 6 hours: To view alarms that occurred within the last 6 hours.
- Last 12 hours: To view alarms that occurred within the last 12 hours.
- Last 24 hours: To view alarms that occurred within the last 24 hours.
- Last 7 days: To view alarms that occurred in the past week.
- Last 30 days: To view alarms that occurred in the past 30 days.
- Custom: Click the Calendar and Clock icons to set the date and time for the period start and period end, and then click Apply.
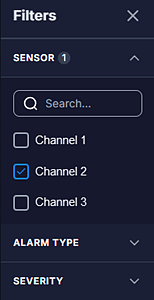
- By sensor: Select the checkbox for one or more sensors you want to view. To filter the list, type some or all of a sensor name in the Search box.
- By alarm type: Select the checkbox for one or more alarm types you want to view. To filter the list, type some or all of an alarm type in the Search box.
- By severity: Select one or more alarm severities to display, or select Select All to view all alarm severities.
- By alarm status: Select one or more statuses to display:
- Active: To view only active alarms.
- Resolved: To view only resolved alarms.
- Clear: To view only cleared alarms.
- By acknowledgment status: Select the acknowledgment status to display:
- Acknowledged: To view only acknowledged alarms.
- Unacknowledged: To view only unacknowledged alarms.
Acknowledge an Alarm
To let your team know that you are investigating an alarm:- In the alarm summary, click the alarm.
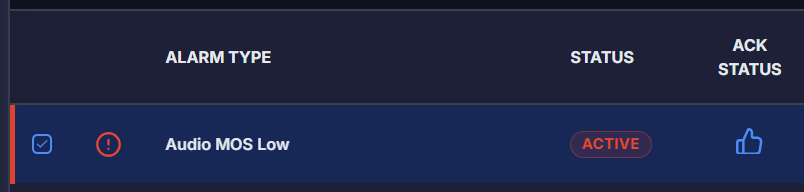
- In the Alarm Details pane, click Acknowledge. A blue check mark appears beside the alarm to indicate that it has been acknowledged.
Add a Note About an Alarm
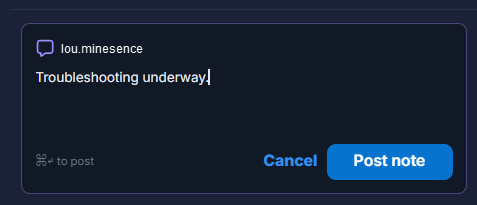
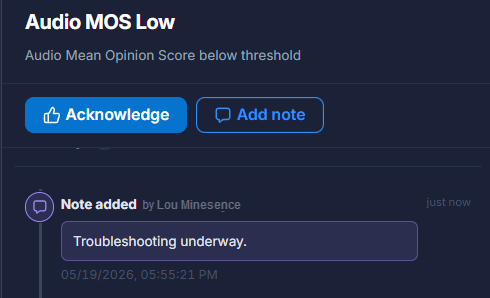
You can add a note to log your troubleshooting steps or findings so your colleagues can see what has already been done. To add a note:- In the Alarm Details pane, click Add Note.
- Type a note and click Post Note.
Export Alarm Data
You can export alarm data to a JSON file and then import it into third-party visualization or aggregation tools. To export alarm data:- Click Export JSON.
- In the dialog box that appears, choose whether to open the exported data or save it locally.
Visual Trending
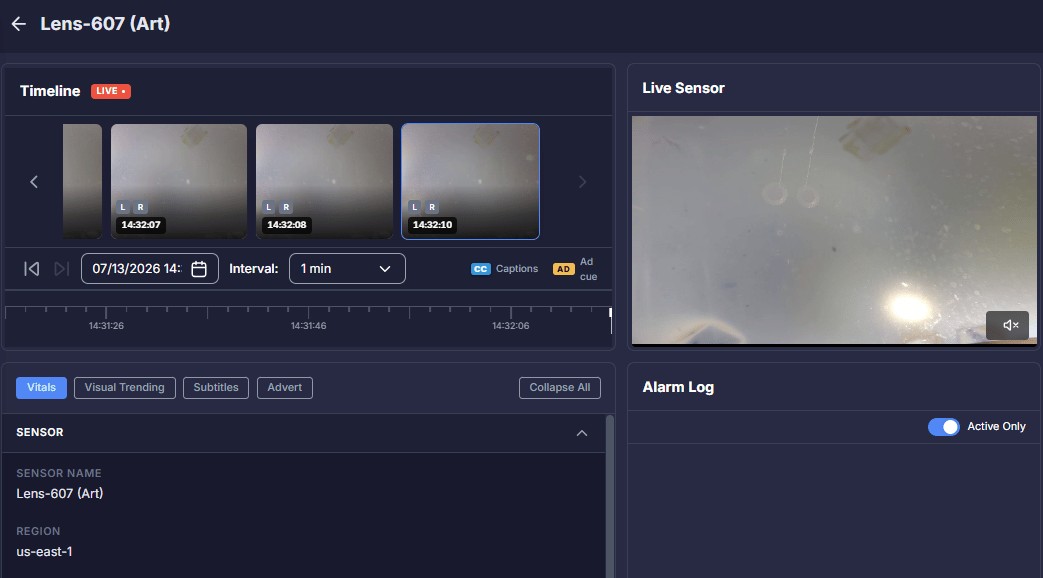
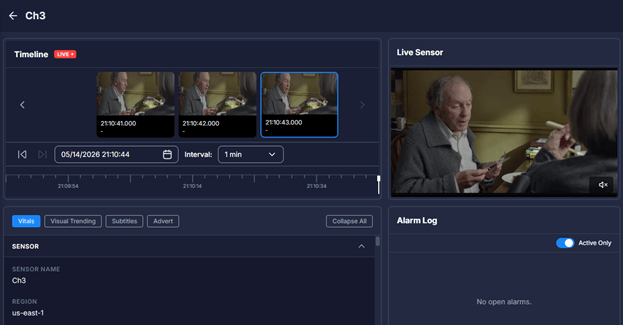
On the Visual Trending screen, you can explore and analyze historical monitoring data for any source in a time-aligned and visual format. It combines real-time thumbnails, user-selectable metric graphs, and timeline navigation tools for in-depth analysis of stream health, media quality, and content behavior. On the Visual Trending screen, you can:- Visualize historical video/audio/network metrics across a selectable timeline.
- Align graphs with video thumbnails and key timestamps.
- Enable or disable metric tracks via a dynamic control panel.
View Visual Trending
To view the Visual Trending page, do one of the following:- From the Sensors page: Click the Edit icon beside a sensor and select View Visual Trending.
- From a sensor preview: From the Preview panel for the sensor, click Analyze. The timeline on the Visual Trending page snaps to the current playhead so you can begin looking backward for context.
- From the Alarm Log widget: Click an event listed in the widget.
- From the Alarm Log: Click the Edit icon beside an alarm and select View Visual Trending. The timeline on the Visual Trending page snaps to the moment the alarm was triggered.
Navigate the Timeline
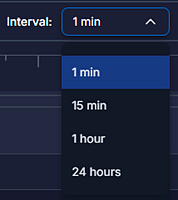
In the timeline, use navigation tools to scroll backward through the historical data.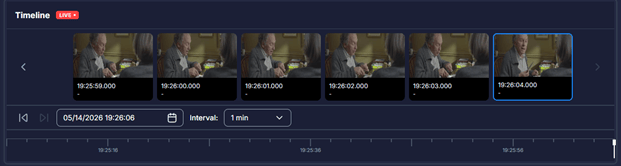
Correlate Thumbnails and Markers
As you navigate the timeline, you will see visual thumbnails aligned with your graphs. These thumbnails are captured every second. Along the timeline are indicators for metadata events, such as SCTE-35 ad-insertion markers.Return to Live Monitoring
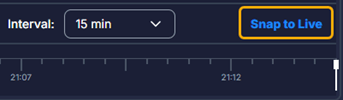
When you are done analyzing an issue, click Snap to Live to snap your timeline back to the current live playhead so you can resume real-time monitoring.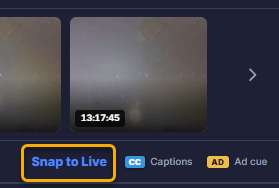
Live Sensor Pane
In the Live Sensor pane, you can view the sensor’s live video. Click the Speaker icon to mute or unmute the audio.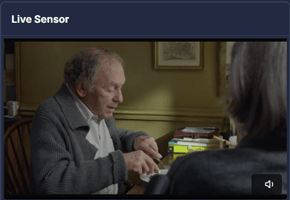
Alarm Log Pane
The Alarm Log pane on the right displays the active alarms by default. To view only active alarms, turn on the Active Only toggle.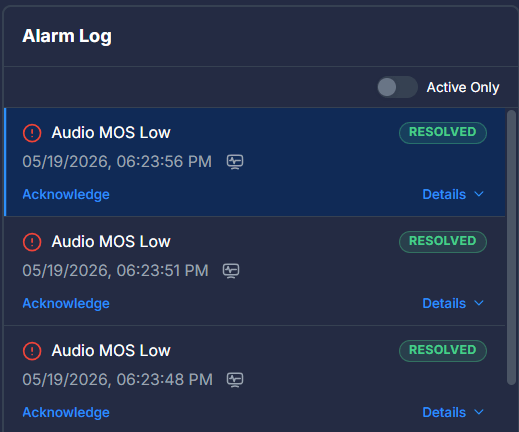
View Vitals
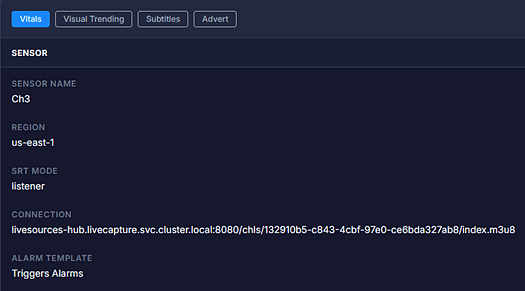
The following sensor data is displayed on the Vitals tab:- Sensor name
- Sensor region
- SRT mode
- Connection
- Alarm template
- Transport stream program PIDs, types, and descriptions
- Video PID
- Video codec
- Resolution @ FPS
- Profile @ Level
- Chroma format
- Video Bitrate
- For each audio PID:
- Language
- Audio codec
- Channels
- Sample rate
- Audio bitrate
View Graphs
On the Visual Trending tab, you can use the control panel to enable or disable specific metric tracks that you want to investigate. For example, you can select specific KPIs such as bitrate and Video MOS (perceptual quality) to graph them side-by-side, allowing you to easily see how drops in bandwidth impacted the visual quality of the feed over time. Click the Graph icon to select the graphs to view:- Source graphs: Bitrate, RTT (Round Trip Time), Latency, Dropped Packets, Received Packets, Received Bytes, Receive Buffer, and Path Bandwidth
- Transport Stream graph: Transport Bitrate
- Video/Audio graphs: Video MOS, Audio MOS, Video Bitrate, Audio Bitrate, and Loudness
- Subtitle/Caption graph: Caption Coverage
- Ads graph: Ad Breaks
Analyze Subtitles
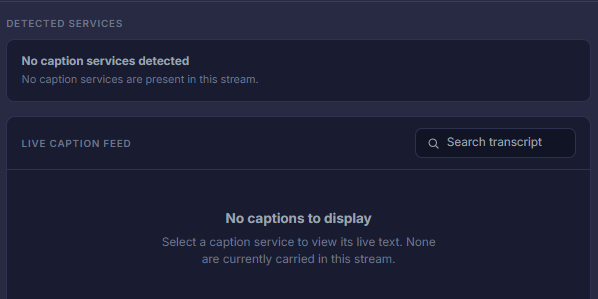
To analyze subtitles, click the Subtitles tab. Lens decodes the subtitle data stream and tracks its performance over time. It goes beyond simple on/off detection by evaluating the technical integrity of the text. Key features include:- Presence tracking: A continuous log that confirms subtitles are being delivered second by second.
- Integrity analysis: Detecting mangled or garbled text, illegal characters, and formatting errors that make captions unreadable.
- Metadata validation: Confirming that the subtitle track matches the expected language.
- Sync monitoring: Tracking the timing relationship between the text and the audio/video signals.
Analyze Advertisements
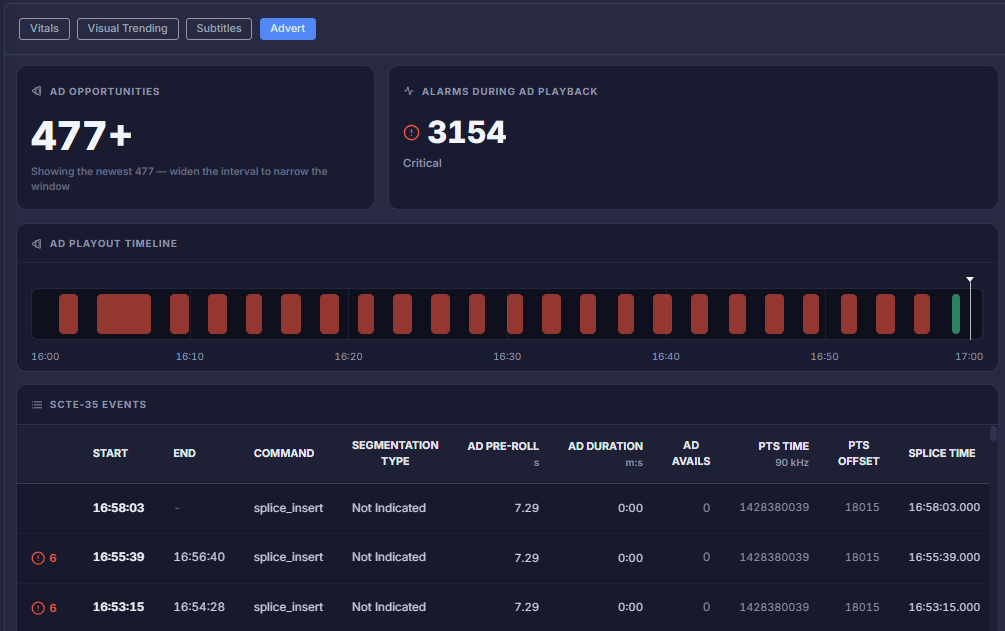
To analyze advertisements, click the Advert tab. Analyzing advertisements is a continuous monitoring process within the Premium Sensor tier that looks for specific digital markers inside SCTE-35 messages. It does the following:- Detects whether the ad-triggering messages exist in the stream.
- Ensures that ad breaks occur at the correct intervals.
- Decodes the details inside the trigger, such as the intended duration of the break and the specific type of ad opportunity.